2022 Q2 Investor Update Letter
Commentary by Grant Laschowski and Shiraz Ahmed
In this issue
- Global Markets
- Stocks
- Commodities
- Exchange Rate: CAD/USD
- Valuations: U.S. Stocks
- Inflation and Interest Rates
- What’s Next?
As we head into the dog days of summer, I can’t help but remember when I was a child playing outside with all the neighborhood kids. We would all gather in the middle of the crescent to discuss what game to play that day. Sometimes it would be road hockey (a national pastime for every boy in Canada), tag, or our favourite hide-and-seek. For all of you unfamiliar with this popular children’s game, it consists of numerous “hiders” and one “seeker” (designated as being “it”). Those hiding try to conceal themselves in a set environment. For us, that was our street. In contrast, the seeker tries to find them within a set timeframe. The way the game ends varies, but the most common one is the “it” player locates all the hiders. The one the player found first is the loser and is chosen to be "it" in the next game. The one the player found last is the winner. The game was fun and challenged us to be defensive (hiding) and offensive (seeking).
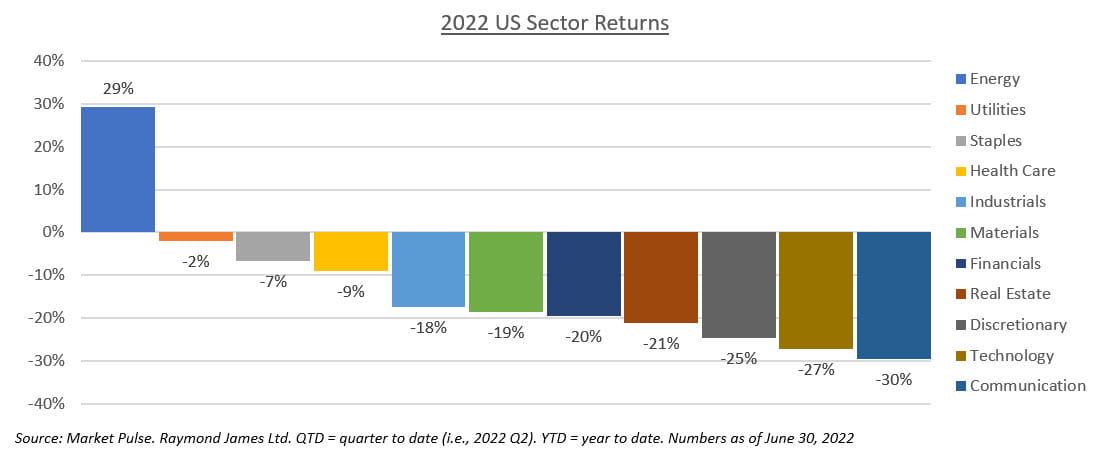
Today, as advisors, we’re witnessing numerous investors, professional and retail, attempting to “hide” from the markets, and at first glance, it seems to be the case. Apart from energy, every other major sector in the U.S. has experienced significant losses this year (see graphic below). We will dive deeper into some of the factors contributing to this year’s selloff in our 2020 Q2 Investors Update Letter below. But for now, we’d like you to put on your “seekers” hat. And as Warren Buffet, one of the greatest investors of all time, once said, “you need to be greedy when others are fearful, and fearful when others are greedy.”
Global Markets
Stocks
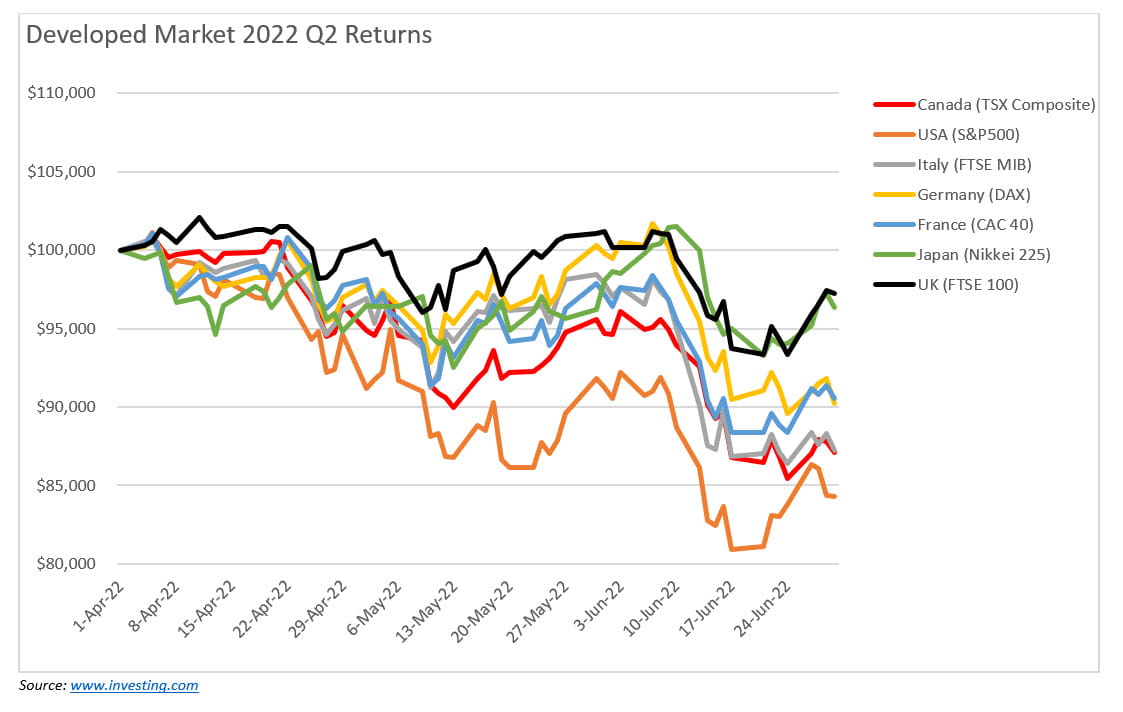
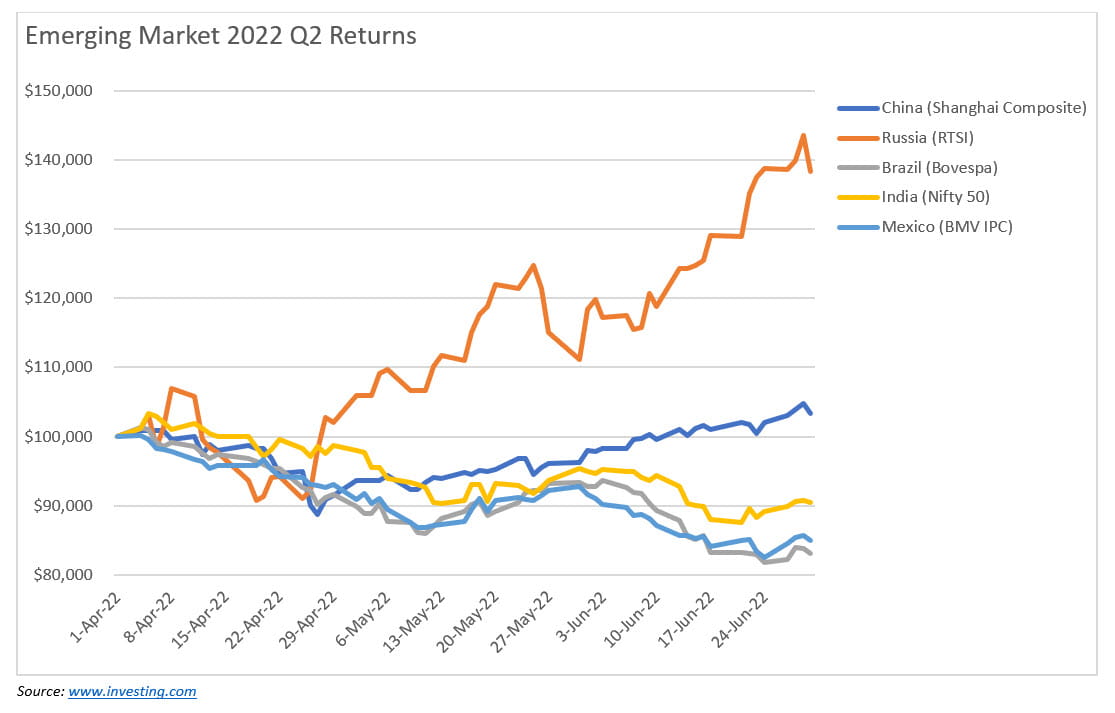
On the surface, it looks like investors have had nowhere to hide this year. Stock markets across all G7 countries and most emerging markets (see both graphics below) have struggled during the second quarter of 2022, with Russian and Mexican stocks being the exceptions.
While never perfect, our systems are designed to select investments on two primary factors: risk and return. It’s designed to take emotions out of the investment decision process and replace them with logic and reason, utilizing pricing data and momentum factors to choose investments that will give the best chance of earning positive returns and keep the risk of the portfolio in check. Using momentum allows us to identify losing investments to avoid (i.e., tech stocks) and winning investments to purchase (i.e., commodities).
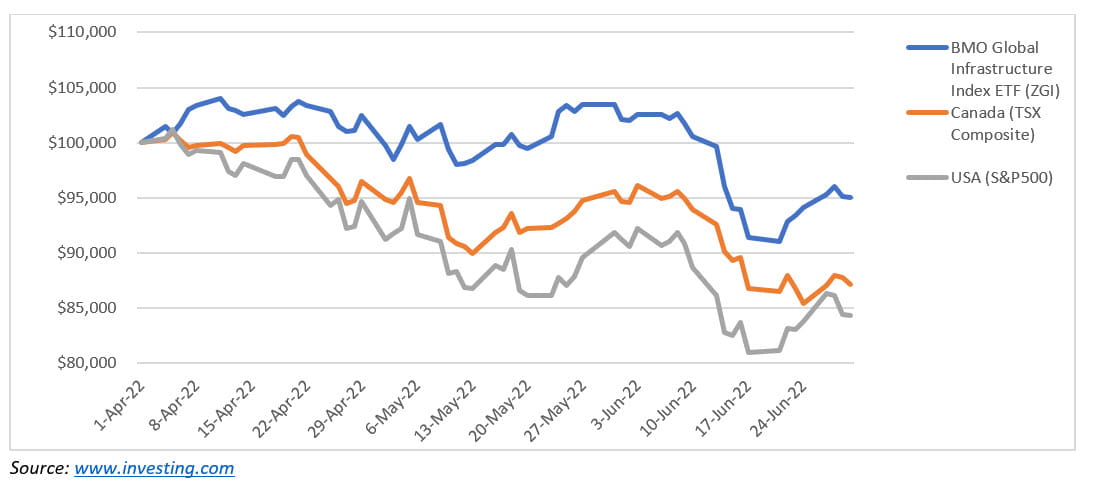
In our $CAD Balanced ETF model, which serves as a “pension-like” portfolio for some of our clients, exposure in their portfolio to passive equity ETFs has been kept to less than ~8.5 per cent for all of April, May, and June (i.e., 2022 Q2). This has significantly helped reduce any significant declines in their portfolios attributed to equities. We’ve maintained zero exposure to Asian stocks for the time being, along with global small-cap, technology, and marijuana stocks. Over the past 90 days, we have continued to increase our exposure to global infrastructure stocks (i.e., BMO Global Infrastructure Index ETF: ZGI), which now represent the largest weighting (approx. ~35 per cent) in our $CAD Balanced ETF model. Compared to Canadian and U.S. stocks, which are down more than ~12 per cent, our exposure to the BMO Global Infrastructure Index ETF has helped reduce portfolio risk and drawdown for our clients during Q2 (see graphic below).
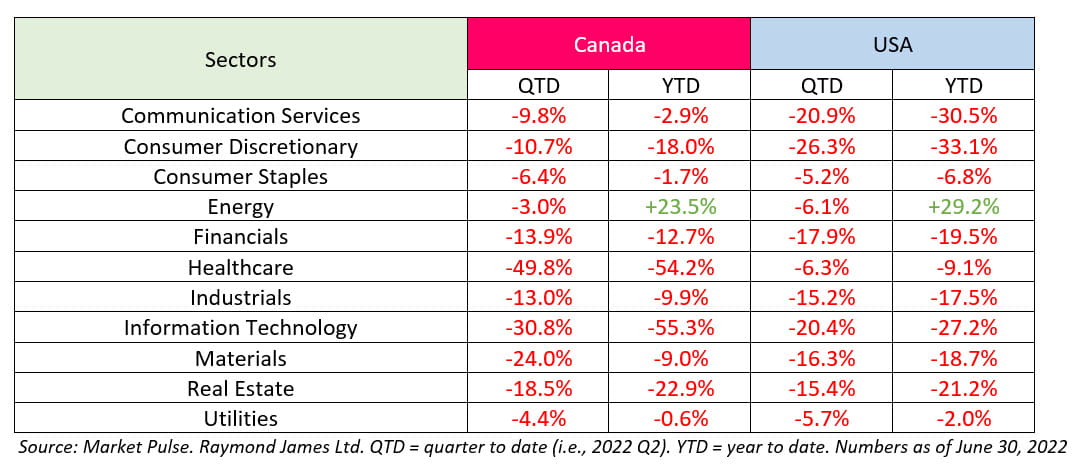
Moving forward, let’s now look at the various equity sectors of both the Canadian and U.S. markets (see chart below). Every sector posted negative returns during the second quarter of 2022, which substantial declines in Canada are coming from healthcare (-49.8 per cent) and information technology (-30.8 per cent) and in the U.S. coming from consumer discretionary (-26.3 per cent) and communication services (-20.9 per cent). Although the energy sectors in both countries posted negative returns during Q2, their positive performance during Q1 helped keep them positive throughout the year.
Commodities
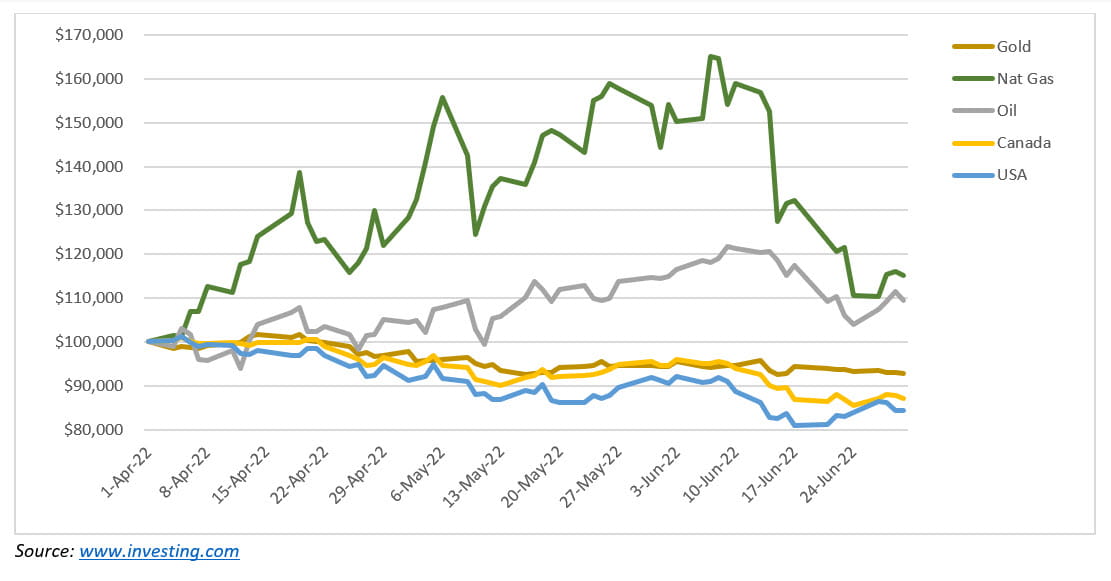
One of the most significant changes we’re making to our $CAD and $USD Balanced ETF models for Q3 is the addition of commodity ETFs to the universe. Inclusion of any investment into our “universe” doesn’t mean we’ll take a position. It simply means it’s now included in the list of investments from which we can select. From the chart below, one begins to see the power of having direct exposure to commodities like natural gas and oil.
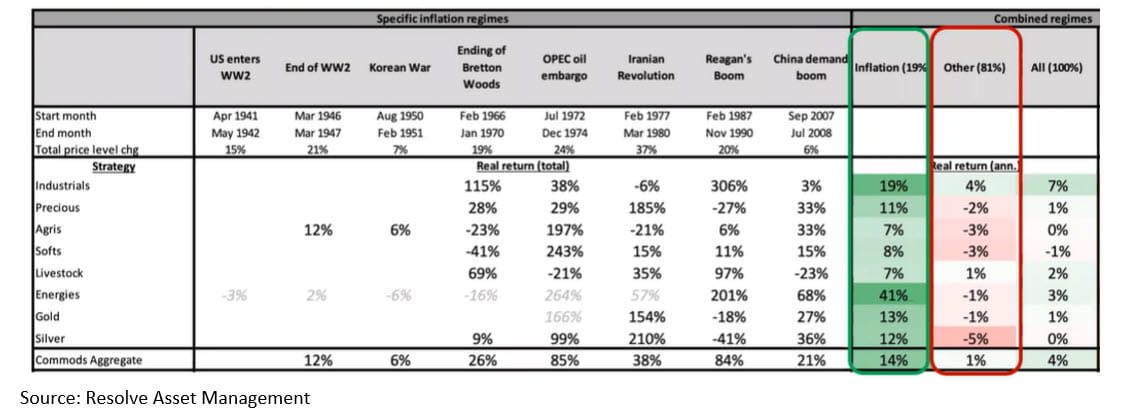
With inflation at nearly 40-year highs and interest rates rising, investors have been challenged with regressing global equity and bonds markets this year. Since 1926, the U.S. has been in an “inflationary regime” 19 per cent of the time (see graphic below). It was found that during these periods, commodities proved highly resilient and offered real returns at an average of 14 per cent, with energies (+41 per cent), industrials (+19 per cent), and gold (13 per cent) leading the way. We believe failure to include commodities in an investment universe is missing an essential part of the potential investing landscape.
Exchange Rate: CAD/USD
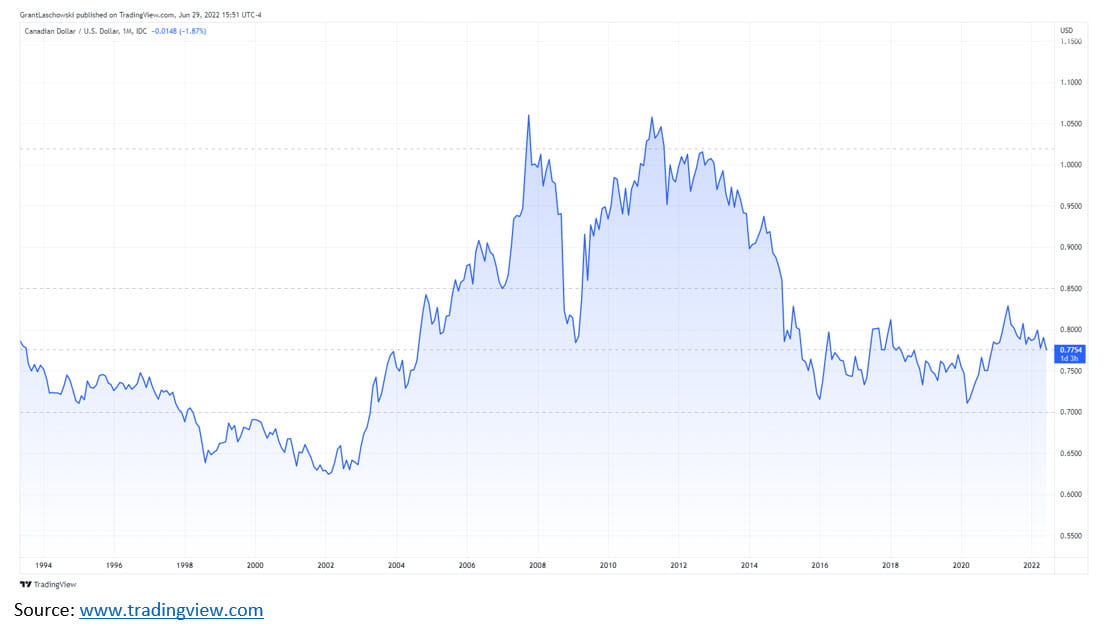
As cross-border advisors, we’re constantly dealing with clients holding both USD and CAD and investments that trade in both countries. Naturally, we’re asked from time to time our thoughts on CAD vs. USD. Our answer usually remains the same, “it depends.” Since 1994, CAD/USD has traded mostly between $0.70-0.85 (see chart below), with a few exceptions. There were a few years during the dot-com boom/bust (i.e., 1998-2003) when the USD was significantly more robust than the CAD and then leading up to and after the U.S. credit crisis (i.e., 2006-2013) when the CAD significantly outpaced the USD. Outside of these instances, it didn’t matter much from an exposure point of view which currency you held.
Valuations: U.S. Stocks
The last few years have been a stark reminder for many investors, especially younger ones, that the market goes up AND down. Prior to 2022, the S&P 500 had only posted negative returns twice since 2008 (-0.73 per cent in 2015; -6.24 per cent in 2018). That’s quite the run, regardless of how you slice it. During one of the best decades in finance history, market valuations have also increased substantially.
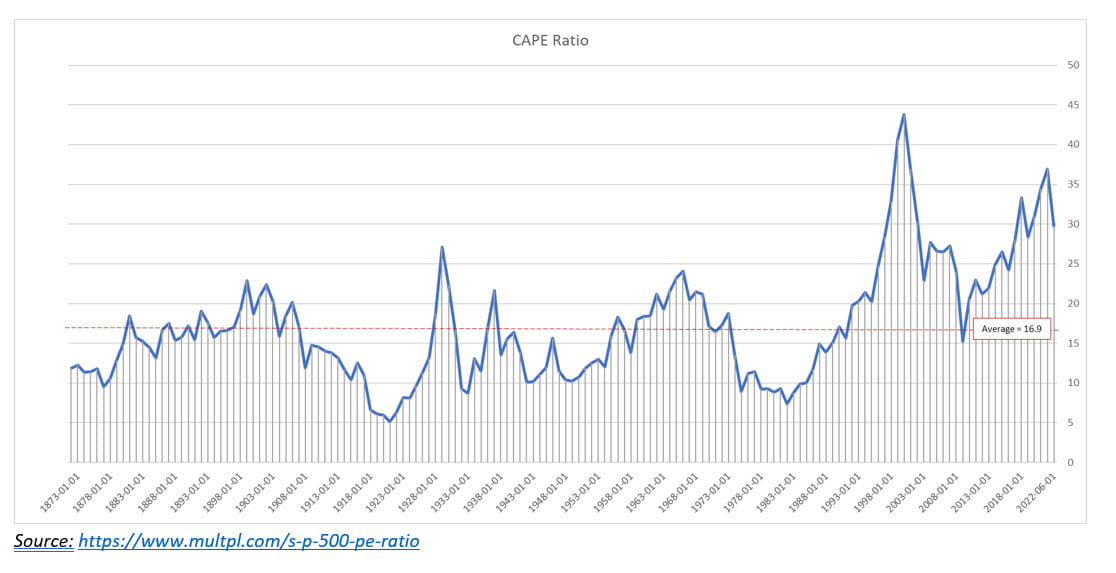
Price-to-earning (P/E) ratios have long been a go-to for investors wanting to understand if markets are over/underpriced. One version of this ratio is the S&P 500 Shiller CAPE Ratio, developed by economist Robert Shiller, which uses inflation-adjusted (i.e., real) earnings-per-share over 10 years. Understanding this ratio is quite simple. The higher the ratio, the more you pay for a company’s earnings, which generally translates into lower expected returns in the future. And vice-versa. Since 1873, the average CAPE ratio is 16.9. Today, the ratio sits at nearly 30 (see CAPE Ratio graphic below). By most accounts, the U.S. market has been overpriced for the past few decades, leading some to believe the “crash of all crashes” is coming. While we disagree with this prediction, looking at where the current CAPE ratio is compared to its +100-year average, we can understand why pundits call for prices to revert to their averages.
Inflation and Interest Rates
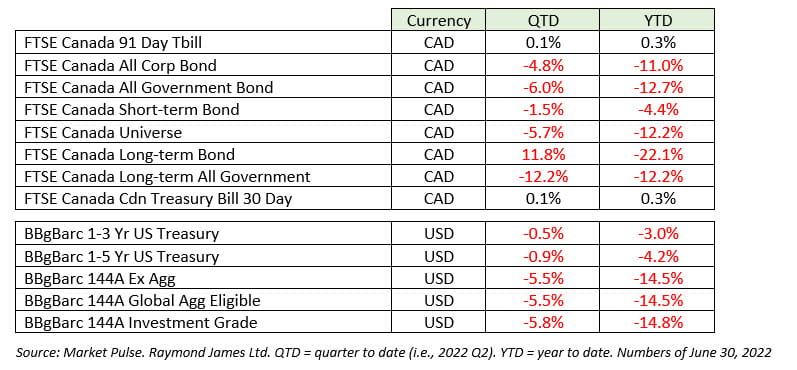
I think it is worthwhile to reiterate a point made in our 2022 Q1 newsletter about the relationship between interest rates and inflation. Interest rates have an inverse (i.e., opposite or inverse) effect on bond prices. As interest rates decline, which they have for the past four decades, bond prices increase. Those +10 per cent yielding bonds from the 1980s now command a significant premium today because investors have two choices: purchase low-yielding bonds in the current market or pay a premium for higher-yielding older bonds. This has been great for retirees or others living on a fixed income who have hung onto those bonds for years, but it seems these glory days are ending. Rates are increasing to combat inflation. This means tough times ahead for fixed-income investors, as their lower-yielding older bonds will now have to be sold at a discount as investors can go into the market and purchase higher-yielding options. Such dynamics can sometimes force conservative investors to move up the risk spectrum into dividend-paying stocks in search of higher yields, which brings forth its own new set of risks. Looking at bond returns (see chart below), it’s clear that the fast rate increases in Canada and the U.S. have led to substantial declines in their respective bond markets.
What’s Next?
And while it may be difficult for many of us to see the bigger picture and maintain a long-term investment perspective given the volatile start to the year, which we acknowledge is especially difficult when a long list of worrisome headlines dominates the news flow (e.g., calls for an imminent recession/hard-landing, job losses, market collapse, etc.), we remind investors, that some of the most beautiful and flawless diamonds on earth were formed under very extreme pressures and over very long periods!
In comparison, and as we demonstrate below, the S&P/TSX index over the very long term (i.e., since the 1980s) has managed to generate returns of ~9.5 per cent a year on average, despite facing many volatile/high-pressure years since then.
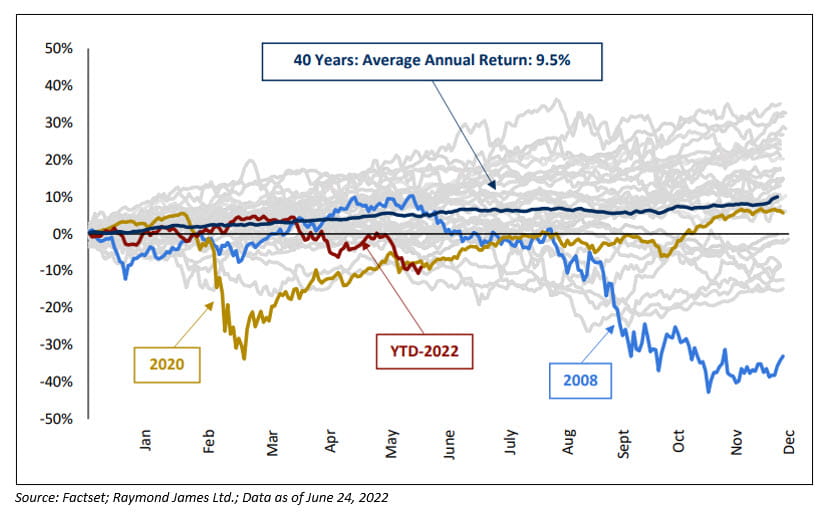
While it may be tempting to avoid all periods of volatility/sharp selloffs in the market cycle by selling when the going gets tough and re-entering when things improve, we remind investors that this strategy of “timing the market” has proven to be rather difficult for even the brightest and most experienced minds to execute effectively. Moreover, we believe a more prudent strategy is to stay invested and seek out opportunities to buy at more attractive valuations. Historically, this has been a much better strategy to deploy for investors over the long term.
1 Information sourced from Raymond James Asset Allocation Quarterly Report
2 Information sourced from Investing.com.
Information in this article is from sources believed to be reliable; however, we cannot represent that it is accurate or complete, and it should not be considered personal taxation advice. We are not tax advisors, and we recommend that clients seek independent advice from a professional advisor on tax-related matters. It is provided as a general source of information and should not be considered personal investment advice or solicitation to buy or sell securities. The views are those of the author, Shiraz Ahmed, and not necessarily those of Raymond James Ltd. Investors considering any investment should consult with their Investment Advisor to ensure that it is suitable for the investor's circumstances and risk tolerance before making any investment decision. Raymond James Ltd. is a Member Canadian Investor Protection Fund. Raymond James (USA) Ltd. (RJLU) advisors may only conduct business with residents of the states and/or jurisdictions for which they are properly registered. Therefore, a response to a request for information may be delayed. Please note that not all of the investments and services mentioned are available in every state. Investors outside of the United States are subject to securities and tax regulations within their applicable jurisdictions that are not addressed on this site. Contact your local Raymond James office for information and availability. This website may provide links to other Internet sites for the convenience of users. RJLU is not responsible for the availability or content of these external sites, nor does RJLU endorse, warrant, or guarantee the products, services, or information described or offered at these other Internet sites. Users cannot assume that the external sites will abide by the same Privacy Policy that RJLU adheres to. Investing in foreign securities involves risks, such as currency fluctuation, political risk, economic changes, and market risks. Raymond James (USA) Ltd., member FINRA/SIPC. This provides links to other Internet sites for the convenience of users. Raymond James Ltd. is not responsible for the availability or content of these external sites, nor does Raymond James Ltd endorse, warrant or guarantee the products, services or information described or offered at these other Internet sites. Users cannot assume that the external sites will abide by the same Privacy Policy which Raymond James Ltd adheres to.