2022 Q3 Investor Update Letter
History Doesn’t Repeat Itself, but It Often Rhymes
Commentary by Grant Laschowski and Shiraz Ahmed
In this issue
- Comparing the 1970s and today
- What in the gold is going on?
- Global markets
- Stocks and bonds
- Commodities
- Canadian real estate
- Recession check-in
- Inflation and interest rates
- Russia/Ukraine
- China COVID restrictions
- Recessionary check-in
- Our latest videos
Comparing the 1970s and today
As poet, dancer, singer, activist, and scholar Maya Angelou so adequately put it, “If you don't know where you've come from, you don't know where you're going”. This saying forces us to go back in time to a period on the minds of many investors today: the 1970s.
The conflict between Syria/Egypt and Israel known as the Yom Kippur War began in 1973 when the Arab coalition jointly launched a surprise attack against Israel. The initial purpose of the war for Egypt was to seize strategic position of the Suez Canal and leverage these gains to negotiate the return of the rest of the Israeli-occupied Sinai Peninsula. The U.S. backed Israel, and the then Soviet Union backed the Arab coalition. This immediately sparked a rapid increase in oil prices as Arab members of the OPEC, led by Saudi Arabia, decided to cut oil production and subsequently suspend exports to the U.S. in response to their support of Israel. This led to the 1973 oil crisis, which saw prices rise nearly 300 percent from USD $3 per barrel to USD $12 per barrel. Inflation in the U.S. jumped from 6 percent in 1970 to nearly 14 percent by 1980. Interest rates soared as a result.
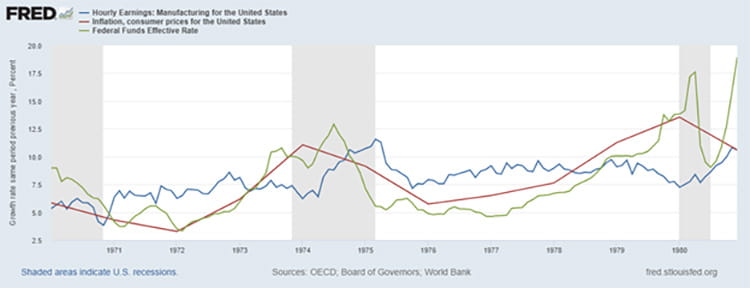
The chart above shows the percentage change in U.S. inflation (red), interest rates (green) and wage growth (blue) during the 1970s.
Today, as food and energy costs rise, geopolitical conflicts escalate, and broad-based runaway inflation flood our daily news feeds, we can’t help but begin to compare current market dynamics to those of the 1970s. While there are many similarities, differences also exist.
One of the main differences between then and now is wage growth. During the 1970s, wage growth ranged between 5 to 11 percent, whereas today, it currently sits under 4 percent. It’s obviously much easier to maintain a standard of living during inflationary periods if your income is matching or exceeding this pace. Herein lies the struggle for many today. In the last 12 months, U.S. food (+11 percent), energy (+23 percent), new vehicles (+10 percent), and shelter (+6 percent) prices have all exceeded wage growth (+4.5 percent). According to the U.S. Bureau of Labor Statistics, $100 last year will only buy you approx. $92 of goods/services today. If you had $100 in 2000, your buying power today would only be around $50. This is how dramatic inflation can be to the value of a dollar over time. If there is any positive to point at it’s that inflation in Canada and the U.S., while remaining stubbornly high, has moderated in recent months. Until we see inflation decline by half, it’s our view that markets will be volatile and rates will likely continue to rise.
Another key difference between today and the 1970s is how much debt is owned by both governments and individuals. Back in the 1970s, household debt to GDP was a fraction of what it is today. This obviously makes absorbing higher rates more manageable. My parents constantly remind me that they bought their first house with mortgage rates near 20 percent. But with little to no debt and rising wages, this was easier to manage than it sounds. Nowadays, we are seeing young real estate investors struggle with 5 percent mortgages.
Key Differences: 1970s vs 2022
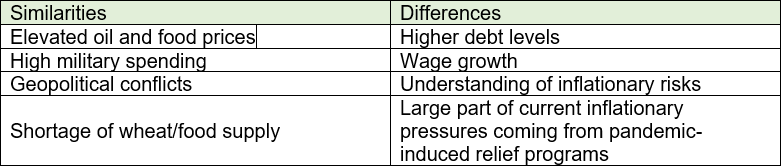
Sources: Adviser Voice (Aug 2022) and Cazenove Capital (Apr 2022)
What in the gold is going on?
Historically, investors have viewed gold as a store of value and a potential hedge against times of high inflation. While not always the case, gold did in fact provide a reasonable hedge during the 1970s when inflation in the U.S. ran wild. During the 1970s, gold returned a staggering 35 percent, further cementing its potential benefits to investors. Unfortunately, the shiny metal hasn’t lived up to its end of the bargain this year. As of October 1st, gold is down -7.17 percent.
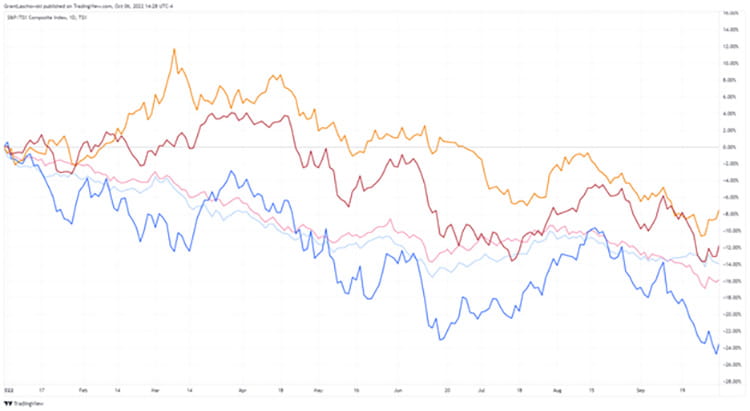
Looking at the above chart, we see U.S. stocks (dark blue), Canadian stocks (dark red), U.S. bonds (light blue), Canadian bonds (light red) and gold’s (gold) performance during this year.
As the calendar flipped over U.S. stocks began to slide, rates began to rise, and bonds sold off. By the end of February, the Ukraine/Russia war was in full swing, which further exacerbated market volatility. Inflation started to really take off from here, and referencing our history lesson from the 1970s, investors would be correct to anticipate a pop in gold prices as a result, which in fact is exactly what happened. Gold peaked on March 8th, reaching an intraday high of $2,078, which translated at that point in the year to an 11 percent rate of return. But then, an odd thing happened. Gold immediately began its 7-month decline to $1,700 where it roughly sits today. What gives? Didn’t we just discuss that gold should be a solid hedge against volatility and inflation? What’s different this time? Well, as the Federal Reserve started to implement tighter monetary policies (i.e., rising interest rates to fight inflation), yields on USD cash have started to become more and more attractive to investors. This caused many to flee gold in favor of the USD, driving down its price to near two-year lows.
Global markets
Equities
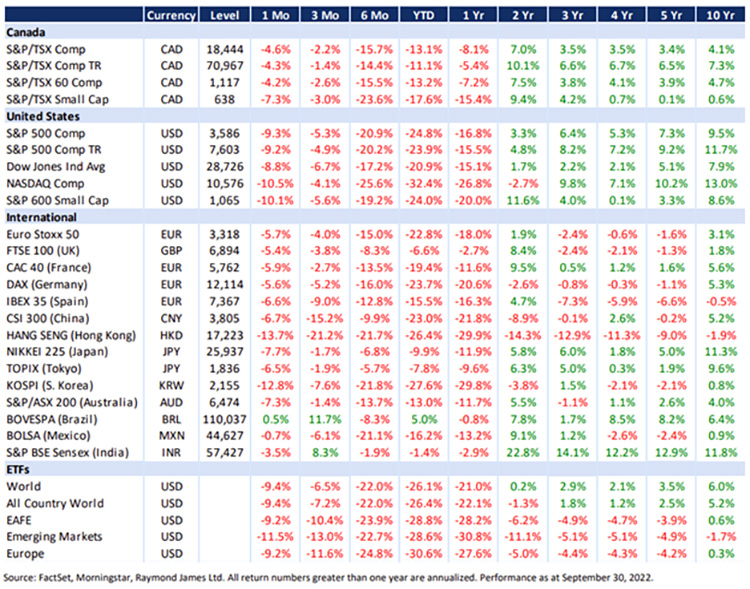
Every market (except for Brazil) has experienced negative returns this year. The third quarter was particularly ugly for U.S. markets, with indexes down more than 8.8 percent in September alone. According to our sources, since 1950, the S&P 500 has only had two worse Septembers: 1974 (-11.9 percent) and 2002 (-11 percent). Most of the decline in September came after the 21st when the Federal Reserve announced their third consecutive “jumbo rate hike” of 0.75 percent, bringing the federal funds rate to 3-3.25 percent. In the following eight days, the S&P 500 lost nearly 7.4 percent. As the November mid-term elections in the U.S. draw near, we are bracing investors to expect continued levels of higher volatility and uncertainty. That’s the negative. The positive is that compared to nine months ago when we had little clarity on the state of the economy, federal reserve intentions and structural issues, today we have a much better understanding of what needs to happen to correct the previously mentioned headwinds.
Fixed income
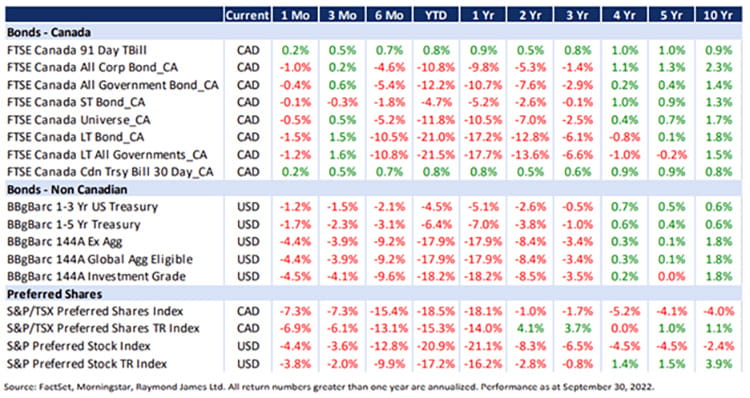
Canadian long-term government bonds are down almost twice as much as the S&P/TSX this year, an astonishing feat however measured. This dynamic makes it all the more difficult for retirees or others who live off a fixed income. Since 2011, there has never been a time when such bonds underperformed equities while they were negative. Simply put, every time Canadian stocks sold off, long-term government bonds achieved positive returns.
With rates on the rise, I find myself talking to our Canadian clients more and more about High-Interest Savings Accounts (HISAs) and Guaranteed Investment Certificates (GICs). As of September, rates on these products are yielding over +3.5 percent and are expected to climb as interest rates rise. Ratehub.ca does a great job of summarizing some of the GIC and HISA products available to Canadian investors. In the U.S., similar cash-type products are called Certificates of Deposit (CDs) – a summary list can be found here. If you’re timid about putting money to work in the markets these days, such short-term cash products might just be what you’re looking for.
Commodities
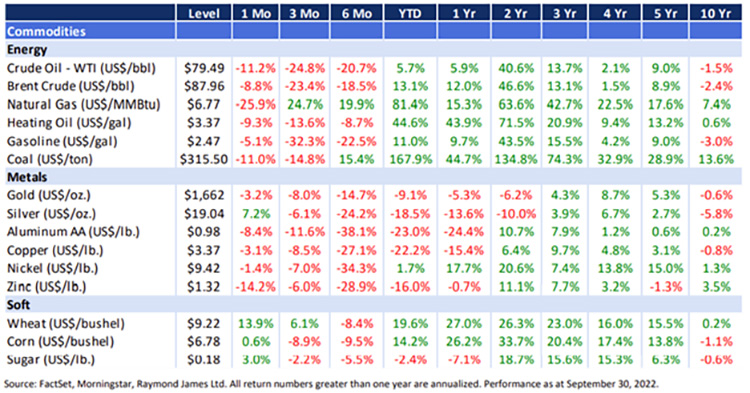
While energy has been the lone bright spot this year, it also had a difficult quarter with crude oil (-24.8 percent), gasoline (-32.3 percent), and heating oil (-13.6 percent) all down big since June. Out of all the commodities we follow, only natural gas (+24.7 percent) and wheat (+6.1 percent) posted positive returns in the third quarter. With two of the world’s top 10 wheat producers at war, it isn’t shocking to investors who understand supply/demand dynamics to see wheat prices increase so significantly this year. According to the World Economic Forum, Russia and Ukraine produce nearly 12 percent of the world’s wheat. Until this conflict gets resolved, we expect continued pressure on commodity supply accompanied with sustained elevated prices.
Canadian real estate
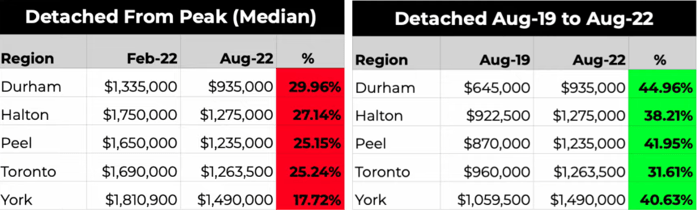
With mortgage rates on the rise, real estate owners in Canada are beginning to feel the pinch. According to the Canadian Real Estate Association (CREA), national average home prices year-over-year (i.e., August 2021 to August 2022) have declined nearly -4 percent. The number of transactions has also declined nearly -25 percent over the same period. Jordan Scrinko from Precondo constantly shares useful YouTube videos highlighting the current state of the real estate market in the Greater Toronto Area (i.e., GTA). In his latest market update (found here) he shared that detached home sales in the 416 have declined by nearly 30 percent since last August. Semi-detached (-29 percent), townhome (-37.7 percent), and condo apt. (-40.6 percent) all saw similar sales declines. As investors, we have to constantly remind ourselves to zoom out and look at the big picture. The two charts below demonstrate why this is so important. From February, when the GTA market peaked, detached home prices are down big. Zooming out, before the pandemic tells a different story. Amid the current selloff, it’s easy to forget just how profitable real estate investing in Southern Ontario has been in recent years. Our advice surrounding physical real estate remains the same: purchase to live not to invest, think long term, and don’t overextend yourself by taking on a mortgage at the top end of your budget.
Inflation and interest rates
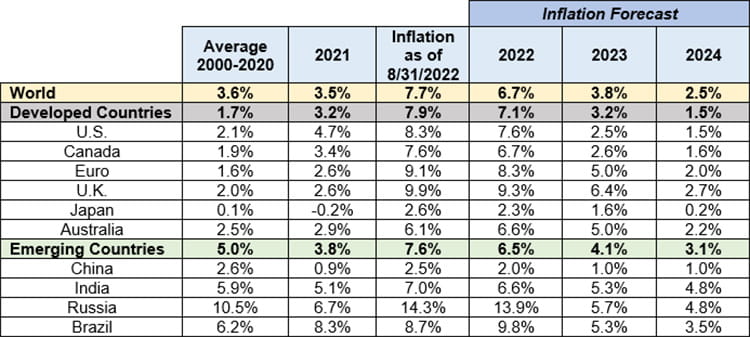
The Consumer Price Index (CPI) is a weighted average of prices for a basket of goods and services – think food, home energy, shelter, apparel, transportation, education, and medical care to name a few. When you hear the word inflation, think of CPI. Increases in CPI mean these goods and services are becoming more expensive and vice versa for when CPI decreases. Below you will find the monthly changes in both Canadian CPI and U.S. CPI. Since the start of the pandemic, central banks have embarked on one of the largest money-printing exercises of all time. The rationale at the time was that the global economy needed such excessive levels of support to avoid a massive catastrophe, perhaps even another Great Depression. Combining this with supply chain issues stemming from the war in Ukraine and COVID restrictions in China, both of which we’ll cover shortly, we see a landscape where excess demand is driving up prices to levels not seen in nearly 40 years.
Source: Capital Economics; Raymond James Ltd.
Russia/Ukraine war
As days turn into weeks and weeks into months, the world remains fixated on the largest war in Europe since WWII. After the invasion on February 24, 2022, many assumed the conflict would be short lived, ending with a quick and deadly takeover of Ukraine by Russia’s large military. Fearing a Russian victory could pave the way for the Kremlin to advance further into European territory, the Western world rushed to support Ukraine, which helped level the playing field between the two countries.
Many initially thought this was a war between the armies of Russia and Ukraine, but those preconceived notions did not account for the reaction of the Ukrainian people. According to the International Institute of Strategic Studies (IISS), Ukraine had 196,600 active military personnel when the invasion began. Today, that number has increased to 700,000 as the Ukrainian population flocked in droves to defend their country. While it is true that Russia’s army is larger – with an active population of approx. 900,000 – the weapons they are using have not been adequately serviced since the Cold War according to some media reports. This is in stark contrast to the state-of-the-art equipment the world has sent to Ukraine, including missile defense systems, which have proved incredibly effective in fighting off Russia’s onslaught of air bombings.
As the war continues, disruptions to wheat and oil production and transportation have fueled further inflation worldwide. Both European sanctions and Russian retaliation crimped supplies of Russian natural gas, which powers electric generators and heats buildings, pushing continental European gas prices to more than 10 times their average historical values. In addition, the inability to ramp up power generation across the European Union (EU) after a slowdown during the pandemic has led to massive increases in monthly electricity prices (see the chart below).
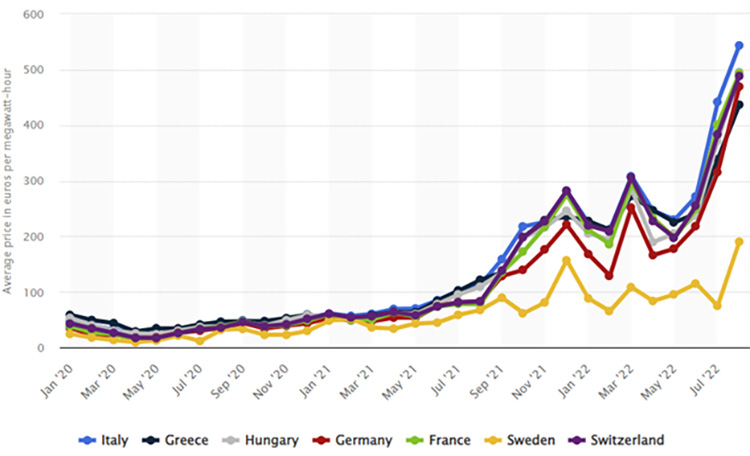
Source: Statista.com
China COVID restrictions
For China’s leader Xi Jinping, maintaining legitimacy is more vital than ever as he seeks to be selected for an unprecedented third term when the Communist Party met for its most important congress in a decade last month. Within the past two weeks, eight megacities have gone into full or partial lockdowns. Together these vital centers of manufacturing and transport are home to 127 million people. Nationwide, at least 74 cities had been closed off since late August, affecting more than 313 million residents, according to CNN calculations based on government statistics. Goldman Sachs last week estimated that cities impacted by lockdowns account for 35 percent of China’s gross domestic product (GDP). Shanghai authorities have ordered the majority of the city’s 16 districts to undergo two rounds of testing. Shanghai saw a jump in infections earlier this month due to an outbreak linked to a karaoke bar. Over the past 10 days, the city has reported more than 400 cases and is currently dealing with its third worse outbreak since the start of the pandemic. The growing outbreak has fuelled fears the commercial hub is headed back into a mass lockdown, just weeks after its residents emerged from two months of grueling home confinement. With elections taking place in October, one can only hope that COVID-imposed restrictions will ease afterwards, allowing for an increase in the production of goods and services. This is important for the world and its fight against inflation.
Recessionary check-in
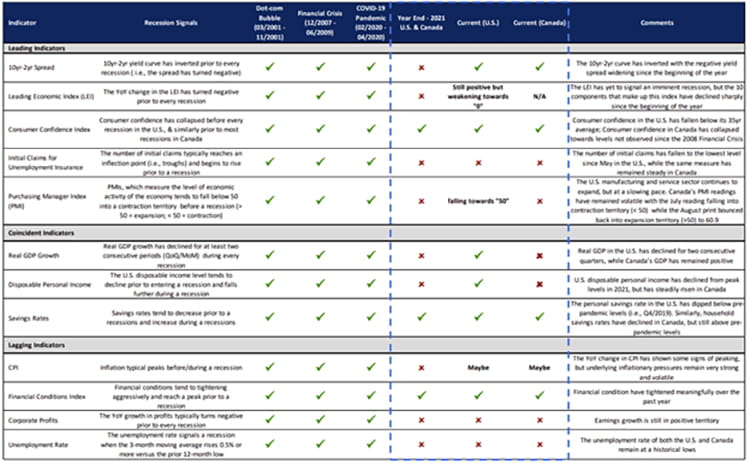
Source: The Changing Seasons – Summer to Fall, but Not Yet Winter, Portfolio Strategy, PGS, Raymond James Ltd.
Our latest videos
Most weeks, we publish short videos on our YouTube channel, covering various financial topics. Feel free to follow our channel, and if you have any topics you’d like us to cover in future videos, please feel free to email shiraz.ahmed@raymondjames.ca. Below are a few examples of some recent videos we’ve done.
- How to Spend $200 million | The Allen Iverson story [view]
- Billionaire buys Hawaiian island for $300 million [view]
- Money strategies for married couples [view]
- Inflation – What does it mean for you? [view]
- Moving to Florida? Watch this first! [view]
Information in this article is from sources believed to be reliable; however, we cannot represent that it is accurate or complete, and it should not be considered personal taxation advice. We are not tax advisors, and we recommend that clients seek independent advice from a professional advisor on tax-related matters. It is provided as a general source of information and should not be considered personal investment advice or solicitation to buy or sell securities. The views are those of the author, Shiraz Ahmed, and not necessarily those of Raymond James Ltd. Investors considering any investment should consult with their Investment Advisor to ensure that it is suitable for the investor's circumstances and risk tolerance before making any investment decision. Raymond James Ltd. is a Member Canadian Investor Protection Fund. Raymond James (USA) Ltd. (RJLU) advisors may only conduct business with residents of the states and/or jurisdictions for which they are properly registered. Therefore, a response to a request for information may be delayed. Please note that not all of the investments and services mentioned are available in every state.
Investors outside of the United States are subject to securities and tax regulations within their applicable jurisdictions that are not addressed on this site. Contact your local Raymond James office for information and availability. This website may provide links to other Internet sites for the convenience of users. RJLU is not responsible for the availability or content of these external sites, nor does RJLU endorse, warrant, or guarantee the products, services, or information described or offered at these other Internet sites. Users cannot assume that the external sites will abide by the same Privacy Policy that RJLU adheres to. Investing in foreign securities involves risks, such as currency fluctuation, political risk, economic changes, and market risks. Raymond James (USA) Ltd., member FINRA/SIPC. This provides links to other Internet sites for the convenience of users. Raymond James Ltd. is not responsible for the availability or content of these external sites, nor does Raymond James Ltd endorse, warrant or guarantee the products, services or information described or offered at these other Internet sites. Users cannot assume that the external sites will abide by the same Privacy Policy which Raymond James Ltd adheres to.