2023 Q4 Investor Update Letter
Commentary by Grant Laschowski & Shiraz Ahmed
In this issue:
- Global equity, fixed income, and commodity returns
- Inflation and interest rates
- Potential U.S. default
- Economic calendar
- Educational resources
Welcome to the latest edition of our Investor Newsletter, where we provide you with insightful updates and analysis on the ever-evolving financial landscape. The past quarter has witnessed a series of significant events that have shaped market dynamics and investor sentiment.
Global equity, fixed income, and commodity returns
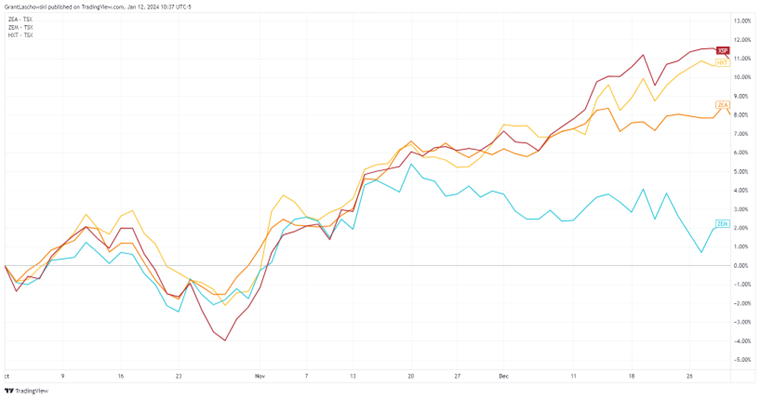
Source: Tradingview.com. iShares Core S&P 500 Index ETF (CAD-Hedged): XSP, Horizons S&P/TSX 60™ Index ETF: HXT, BMO MSCI Emerging Markets Index ETF: ZEM, BMO MSCI EAFE Index ETF: ZEA.
The fourth quarter of 2023 proved to be one of the best in recent memories, especially when honing on the month of November, which was one of the best months experienced ever. Despite a somewhat disheartening October, everything ended up making money. The S&P 500 Index (red) and the S&P/TSX 60 Index (gold) were both up over +10 per cent. On the international front, the MSCI EAFE Index (orange) was up +8 per cent and the MSCI Emerging Markets Index (teal) finished the quarter up over +2 per cent, but there was a noticeable divergence in December when the index seemed to pullback while others continued their ascent.
Equities
In addition to our buy-and-hold investment mandates, we manage two model portfolios for our clients that utilize momentum-screening strategies to select investments in stocks, bonds, and ETFs.
At the beginning of the year, in our North American Equity portfolio, our screening systems detected minimal or no opportunities in the technology sector, which was not surprising, considering the NASDAQ 100 Index's significant decline of over 32 per cent in the previous year. However, the tech sector has made a remarkable comeback, surging by more than 32 per cent in the first half of 2023, finishing the year up over +43 per cent. This amount of strong momentum has led us to adjust our portfolios, resulting in an average allocation of +21 per cent to tech stocks since September. Prominent companies such as Nvidia, Netflix, Altair Engineering, Palo Alto Networks, Apple, and Microsoft were included in the portfolio. While we initially held a small percentage (<5 per cent) in financial stocks during the first quarter, the banking crisis in March prompted us to completely exit the sector. It was only in December that we started to nibble away and reallocate to the sector, purchasing company stock in firms like Blackstone and The Caryle Group. Additionally, key energy stocks like Marathon Petroleum and Cameo played a large role in our portfolios throughout the year. Allocations to the energy sector average over 23 per cent for the fourth quarter.
In terms of ETF investments, in our Balanced ETF models we significantly increased our exposure to Europe throughout the fourth quarter, resulting in an average allocation of +13 per cent. As markets marched upwards, we also started to increase exposure to more unique investments such as the ARK Innovation ETF and Evolve E-Gaming ETF. By the end of December, these two ETFs represented over 17 per cent of the portfolio. Throughout October and November, we allocated about a quarter of the portfolio to bonds. This ramped up significantly in December, as bond yields fell and prices rose, we took advance and upped our allocation to nearly 40 per cent.
Fixed Income

Over the past few years, there has been a significant increase in yields on North American government bonds due to central banks raising interest rates to combat inflation. However, this aggressive approach appears to have eased for the time being, as indicated by government bond yields remaining relatively stable throughout 2023.
As we mentioned in one of our previous newsletters [link], fixed income investors experienced a dreadful past year as yields increased significantly, leading to a decline in the value of their previously purchased bonds. However, amidst this unfortunate situation, there is a silver lining. The current scenario presents an opportunity for new investments to be made at higher rates, reminiscent of the levels not seen since the subprime mortgage crisis in 2008. Canadian high-interest savings accounts (HISAs) and U.S. certificate of deposits (CDs) are offering investors an impressive return of nearly five per cent over one year. With market practioners expecting rate cuts sometime in the backhalf of 2024, fixed income investors will likely begin to also see capital appreciation from their bond holdings purchases in 2023.
Stock-bond Correlation, 3-yr Rolling Window
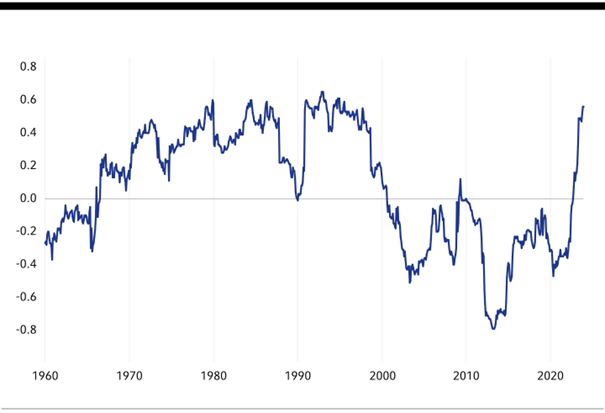
Source: Russel Investments, 24’ Global Market Outlook. [link]
The past few years have been tough for investors with diversified portfolios. The conventional 60/40 approach faced challenges in 2022 and saw a slow recovery in 2023. The problem? Stocks and bonds are now moving in sync, offering no counterbalance when stocks dip. The rise in interest rates, with the 10-year U.S. Treasury yield going from 1.5 per cent in early 2022 to almost 4.5 per cent by late 2023, diminished bonds' ability to stabilize portfolios, holding back overall returns.
Looking to 2024, could the stock-bond correlation turn negative? Typically positive during unexpected inflation spikes, this correlation tends to decline if Treasury yields rise without a corresponding increase in earnings expectations. Our outlook considers a potential shift back to negative correlations as supply chains recover, the Federal Reserve addresses inflation, and recession risks emerge. In simpler terms, government bonds may regain effectiveness in diversifying portfolios, hinting at a potential return for the classic 60/40 portfolio.
Commodities
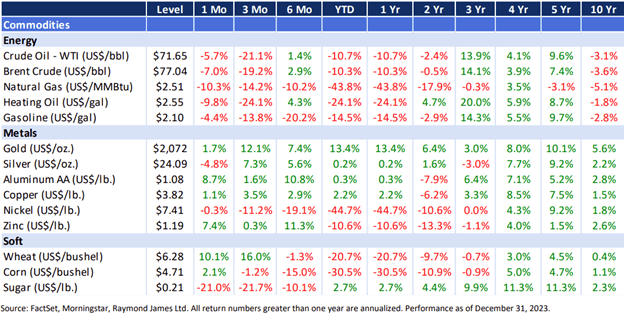
Commodities, excluding gold, faced significant challenges throughout last year. Among the 15 commodities we track, only five showed positive performance. The S&P GSCI Index [link], a gauge of the broader commodity market, experienced a negative performance in Q4, dropping by 12 per cent, largely attributed to the struggling energy sector. Oil prices, which reached $122 per barrel in June 2022, have sharply declined to around $70 due to sluggish energy demand. This prolonged decline is fueled by concerns about global oversupply, overshadowing the promises from the Organization of the Petroleum Exporting Countries (OPEC) to limit production. OPEC+, including Russia and other allies, agreed to reduce oil output by 2.2 million barrels per day until the first quarter of 2024, but market skepticism remains regarding full adherence. Worries persist about a potential decrease in crude demand, particularly in China, where signs of a weakening economy are evident.
Inflation and interest rates
In recent years, we've faced exceptional circumstances, beginning with the global COVID-19 pandemic and subsequent shutdowns. Ongoing discussions revolved around whether inflationary pressures would be short-lived. However, 15 months post the initial rate hike by the Bank of Canada (BoC), it's evident that inflation remains a sustained concern. To counter rising prices, the BoC aggressively raised the overnight rate from 0.25 per cent to 4.50 per cent, with the last increase coming in January 2023. Inflation, which peaked in June 2022, has since decreased, currently standing at 3.1 per cent. The BoC's decisions are data-driven and aimed at achieving price stability.
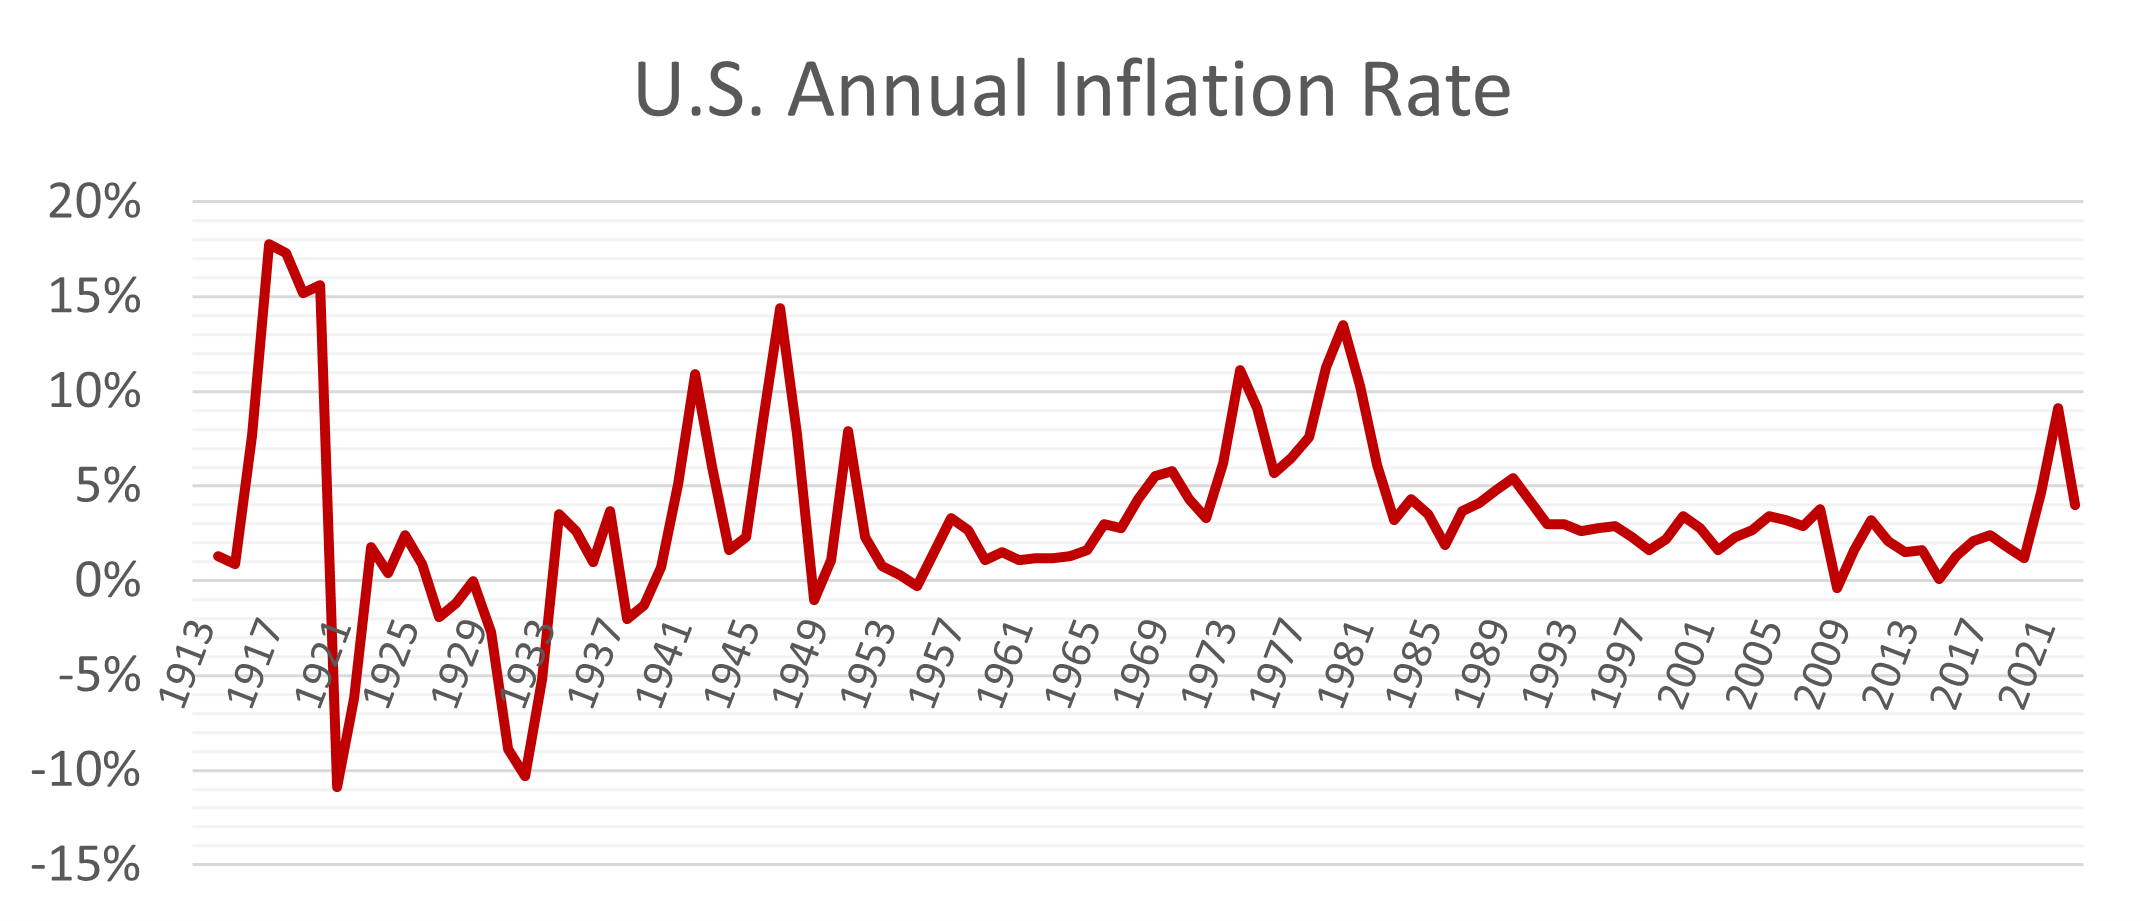
Source: Tradingeconomics, United States Inflation Rate [link]
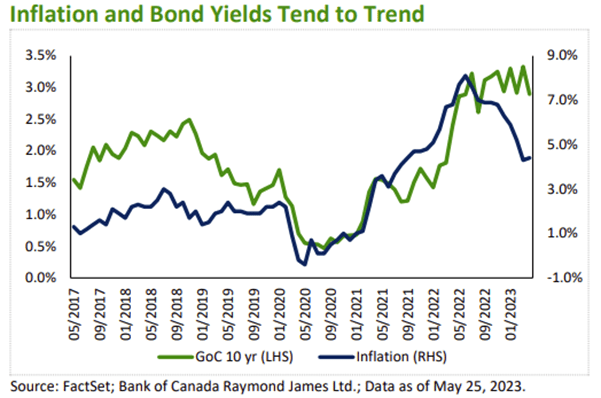
Typically, short-term bond yields are influenced by central bank interest rates, while longer-term bonds reflect expectations of future yields. The graph below illustrates a general correlation when comparing the 10-year Government of Canada bond yield with inflation. However, since November, yields have experienced a decline of approximately 24 per cent, dropping from 4.2 per cent to 3.2 per cent by the end of December. This indicates that market participants foresee stable rates, with potential cuts expected in the latter part of 2024.
In the past, Guaranteed Investment Certificates (GICs) typically yielded higher returns than corporate securities when interest rates were low. However, upon comparing yields across GICs, corporate debt (specifically bank bonds, for illustration), and Government of Canada bonds in the one- to five-year term, it becomes evident that corporate bonds now offer similar or slightly higher yields each year. Each option comes with its own set of advantages and disadvantages, requiring careful consideration from investors before making a decision.
- Guaranteed Investment Certificates (GICs): These secure instruments, often backed by CDIC insurance, provide a safe investment for most individuals. However, they lack liquidity as funds are locked until maturity and cannot be sold or traded before then.
- Corporate Bonds: While these securities carry higher inherent risks compared to GICs, they offer the flexibility of being sold in the open market at any time. Various options with different risk levels and maturities are available.
- Government of Canada Bonds (GoCs): Regarded as benchmark securities with perceived lower risks than corporate bonds, resulting in lower yields. They offer high quality and liquidity for investors seeking low-risk options. Additionally, provincial bonds can be explored as an alternative.
Potential U.S. default
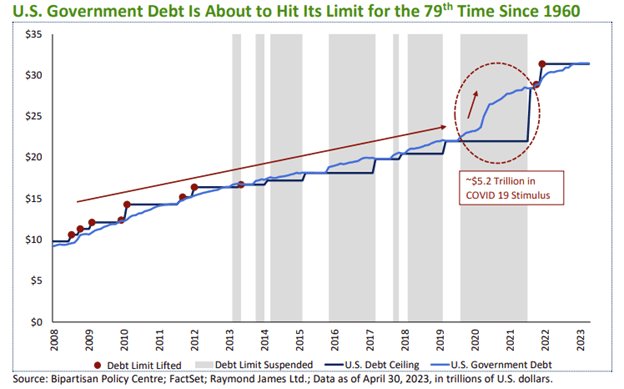
Let's take a quick look at the historical background. In 1917, the U.S. Congress passed the Second Liberty Bond Act, which set a limit on how much the U.S. Treasury could borrow. Before that, each bond issuance required legislative approval. Since then, the debt limit has been raised more than 90 times, with about 78 of those increases occurring since 1960, which averages to roughly once per year. These adjustments were necessary to accommodate the growing borrowing needs of the nation. While most of these increases went unnoticed, there were a few notable instances in recent times that attracted significant attention and captured the public's interest.
Similar to the events of 2023, a noteworthy incident occurred in 2011 when Republicans opposed raising the debt limit without specific concessions on government spending. This sparked a contentious bipartisan negotiation that reached an agreement just hours before the deadline. Similarly, in 2013, a deal was struck with only a day left. The significance of the 2011 events was underscored by S&P, which downgraded the United States' credit rating from AAA to AA+. Now, in 2023, another credit rating agency, Fitch Ratings, has issued a warning of potential similar action.
The key question is not whether an agreement will be reached, but rather how close negotiations will go down to the wire. Even if discussions extend beyond the anticipated "x-date," the Treasury has "extraordinary measures" to ensure short-term cash flow. In the past decade, the debt ceiling has been suspended seven times, allowing the Treasury to temporarily exceed its borrowing limit.
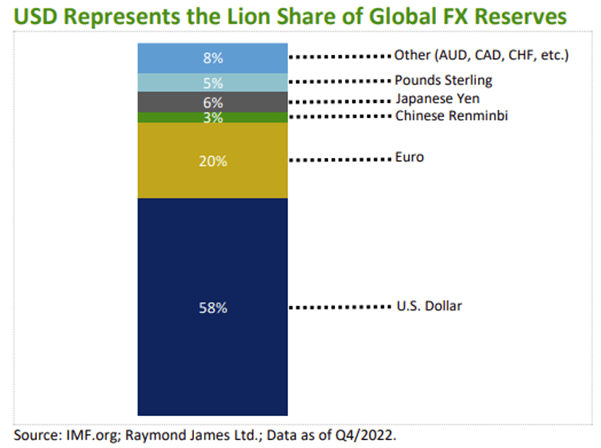
A technical default on U.S. debt could have far-reaching global consequences, potentially challenging the U.S. dollar's status as a reserve currency. While unlikely, pushing negotiations to the last minute or hitting the debt ceiling without a resolution could erode confidence, trigger credit rating downgrades, and increase borrowing costs. This uncertainty might lead to investor sell-offs, impacting the dollar's value. The DXY U.S. Dollar Index has already experienced a nearly 10 per cent decline due to economic concerns and expectations of the Federal Reserve pausing interest rate increases. A weakened dollar would disrupt countries' ability to meet their sovereign debt obligations, as over half of global central bank reserves are held in USD.
While the focus on the debt ceiling captures attention in the headlines, it is essential to remember that various other fundamental factors influence asset valuations. Investors should stay dedicated to their established long-term plans, as these factors have a more substantial impact on investments.
Economic calendar
Here is a list of some of the major economic data that is scheduled to be released during the first quarter of 2024.
- Jan 24: Bank of Canada Interest Rate Decision
- Jan 25: U.S. GDP Announcement
- Jan 31: U.S. Federal Reserve Interest Rate Decision
- Feb 13: U.S. Inflation Data Release
- Feb 19: Family Day Holiday in Canada
- Feb 20: Canada Inflation Data Release
- Mar 6: Bank of Canada Interest Rate Decision
- Mar 12: U.S. Inflation Data Release
- Mar 19: Canada Inflation Data Release
- Mar 20: U.S. Federal Reserve Interest Rate Decision
- Mar 29: Good Friday in Canada and the U.S.
Educational resources
As we close out another quarter, we also keep publishing short videos on our YouTube channel, covering all sorts of financial topics. Be sure to follow our channel, and if you have any specific topics you'd like us to cover in future videos, feel free to email Shiraz Ahmed at shiraz.ahmed@raymondjames.ca. Below are a few examples of some recent videos we've done and a few of the articles Shiraz was featured in.
- Breakfast Television Interview [click to view]
- Economic Forecast 2024 | North America [click to view]
- CBC Interview | Grocery Rebate [click to view]
- The Finfluencer Conundrum: Not All Advice is Created Equal [click to view]
- Should You Invest More or Pay Down Your Debt? [click to view]
Information in this article is from sources believed to be reliable; however, we cannot represent that it is accurate or complete, and it should not be considered personal taxation advice. We are not tax advisors, and we recommend that clients seek independent advice from a professional advisor on tax-related matters. It is provided as a general source of information and should not be considered personal investment advice or solicitation to buy or sell securities. The views are those of the author, Shiraz Ahmed, and not necessarily those of Raymond James Ltd. Investors considering any investment should consult with their Investment Advisor to ensure that it is suitable for the investor's circumstances and risk tolerance before making any investment decision. Raymond James Ltd. is a Member Canadian Investor Protection Fund. Raymond James (USA) Ltd. (RJLU) advisors may only conduct business with residents of the states and/or jurisdictions for which they are properly registered. Therefore, a response to a request for information may be delayed. Please note that not all of the investments and services mentioned are available in every state. Investors outside of the United States are subject to securities and tax regulations within their applicable jurisdictions that are not addressed on this site. Contact your local Raymond James office for information and availability. This website may provide links to other Internet sites for the convenience of users. RJLU is not responsible for the availability or content of these external sites, nor does RJLU endorse, warrant, or guarantee the products, services, or information described or offered at these other Internet sites. Users cannot assume that the external sites will abide by the same Privacy Policy that RJLU adheres to. Investing in foreign securities involves risks, such as currency fluctuation, political risk, economic changes, and market risks. Raymond James (USA) Ltd., member FINRA/SIPC. This provides links to other Internet sites for the convenience of users. Raymond James Ltd. is not responsible for the availability or content of these external sites, nor does Raymond James Ltd endorse, warrant or guarantee the products, services or information described or offered at these other Internet sites. Users cannot assume that the external sites will abide by the same Privacy Policy which Raymond James Ltd adheres to.